A real-time energy management platform for large commercial and industrial electricity consumers. Live meter data across a portfolio of sites, penalty exposure in rands, and a what-if engine that prices the fix before any capital is spent.
A single half-hour spike over a site's notified maximum demand triggers a surcharge that lands on next month's bill. Poor power factor adds a second penalty. Property managers running several sites saw none of it until the invoice, and the interval data that explained it sat in the utility's portal, meter by meter.
Energy engineers could suggest fixes, load staggering, capacitor banks, battery storage, but had no way to show a client what each one would actually save. Capital decisions were being argued from spreadsheets.
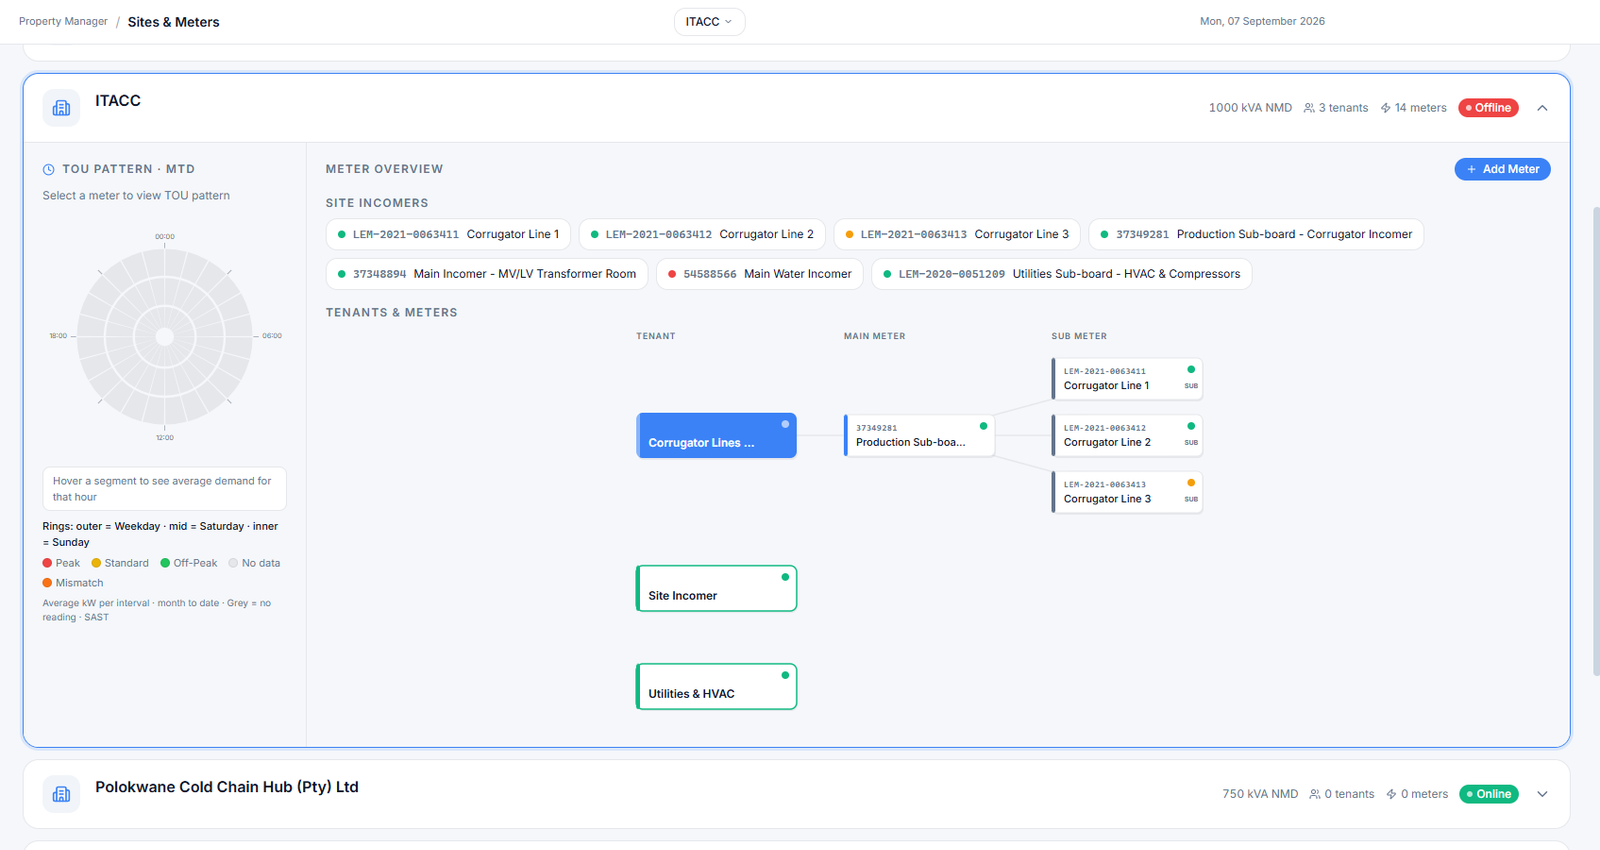
Every site ranked by penalty exposure month to date, with a click-through to its dashboard, its tenants, and the meter tree beneath them. Live readings arrive every thirty minutes from the metering provider's API.
NMD breach events and power-factor violations are detected as they happen and priced against the site's tariff template, so the estimated surcharge is visible weeks before the utility issues it.
A scenario engine models load staggering, power-factor correction and battery storage against the site's own load profile, and reports monthly saving, one-off cost and payback for each.
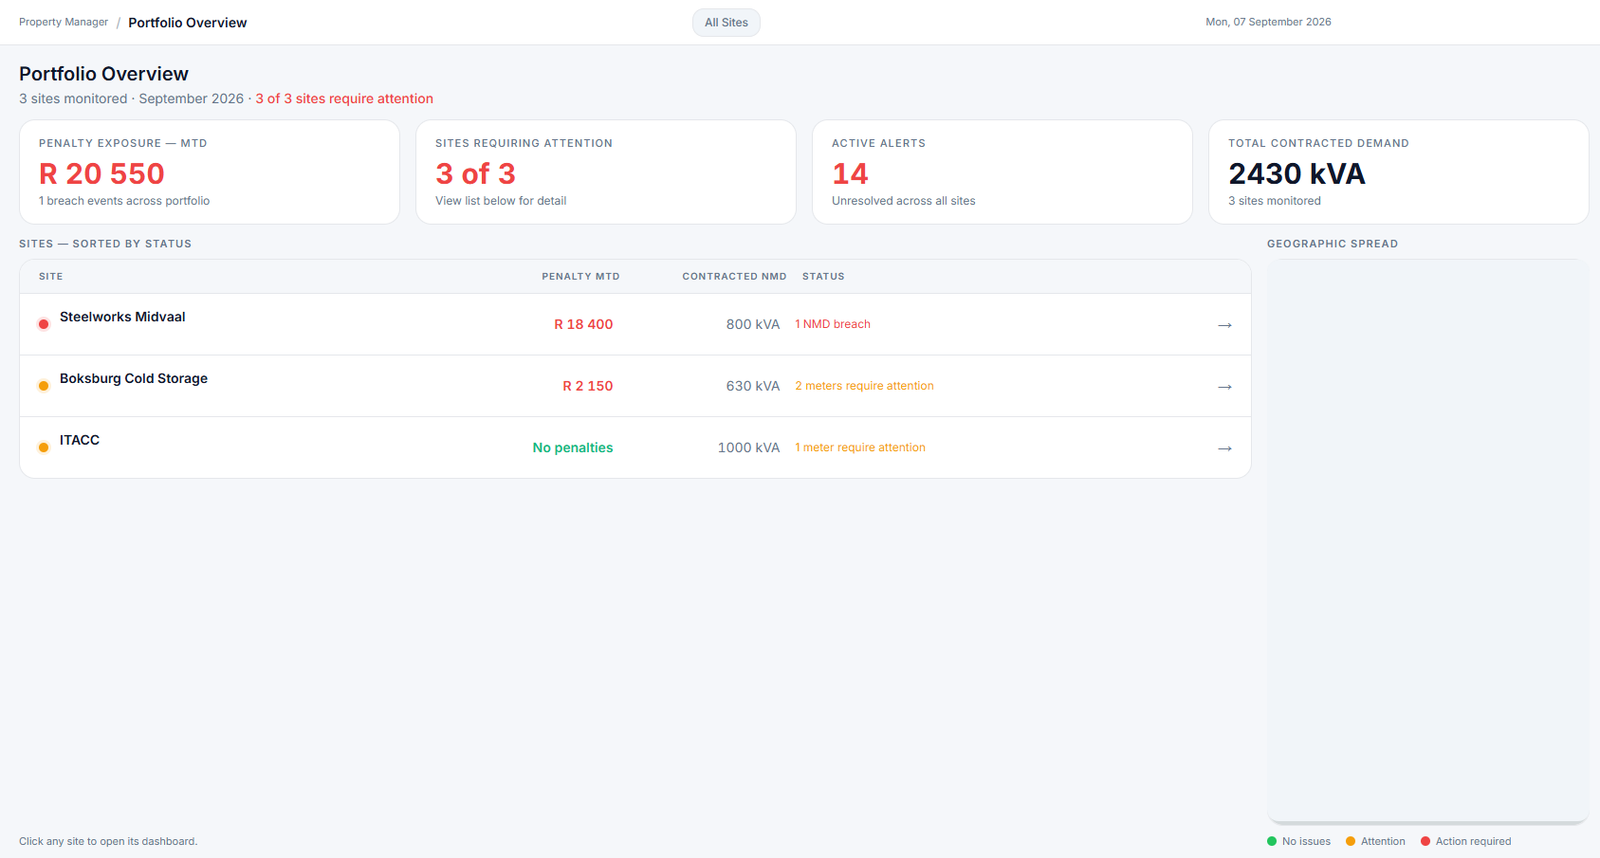
The morning screen. Penalty exposure month to date, which sites need attention, and total contracted demand across the estate. Sites sort by status so the worst problem is always at the top.
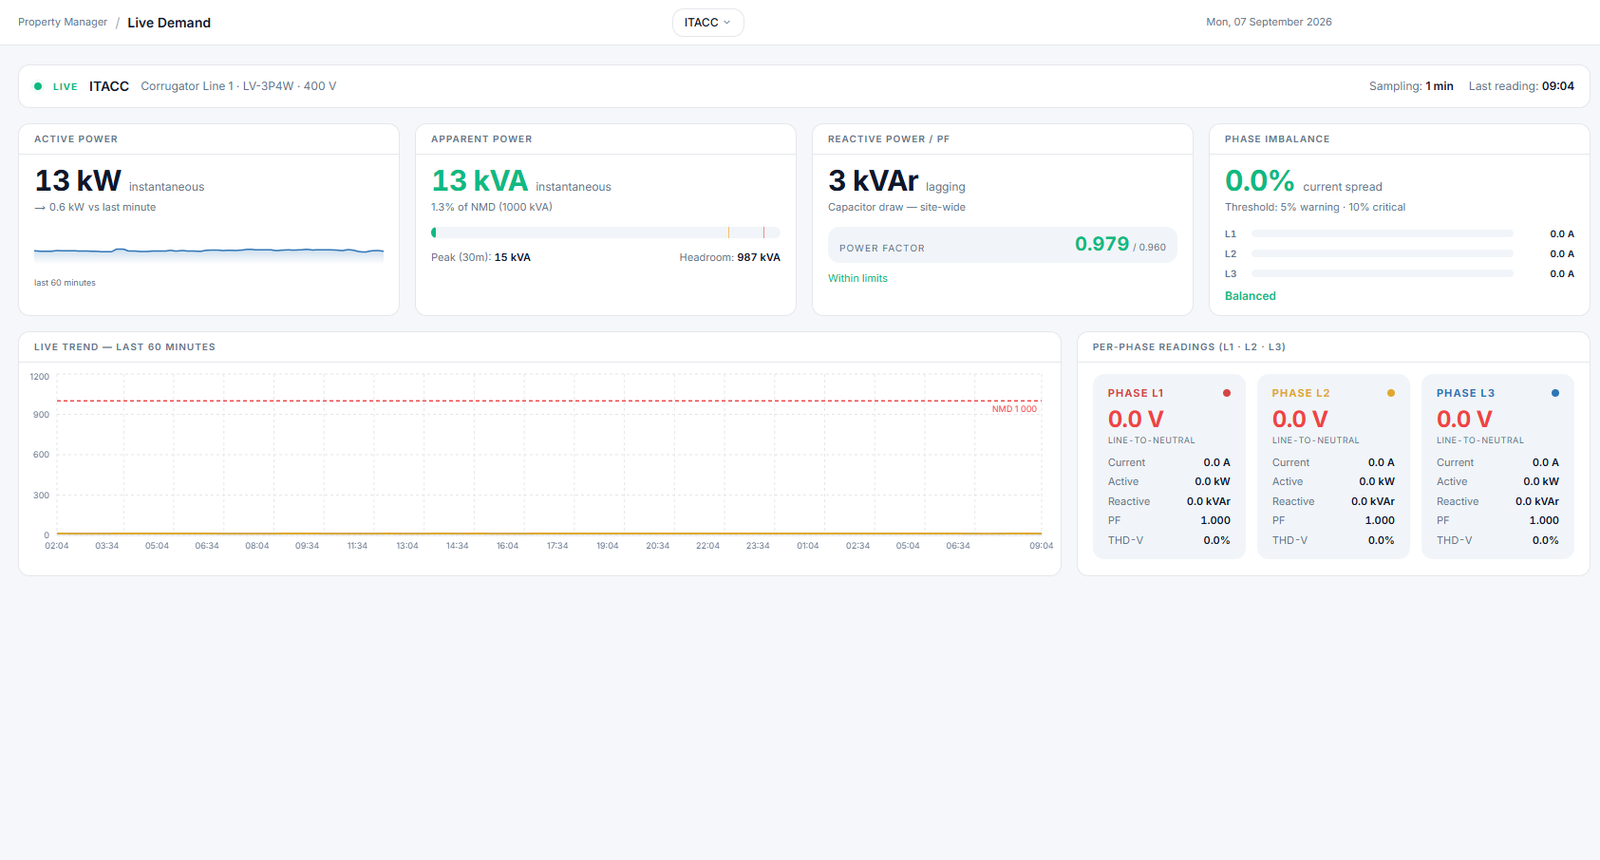
Active, apparent and reactive power for any incomer, headroom against notified maximum demand, and per-phase readings. The NMD line sits on the chart so an approaching breach is obvious at a glance.
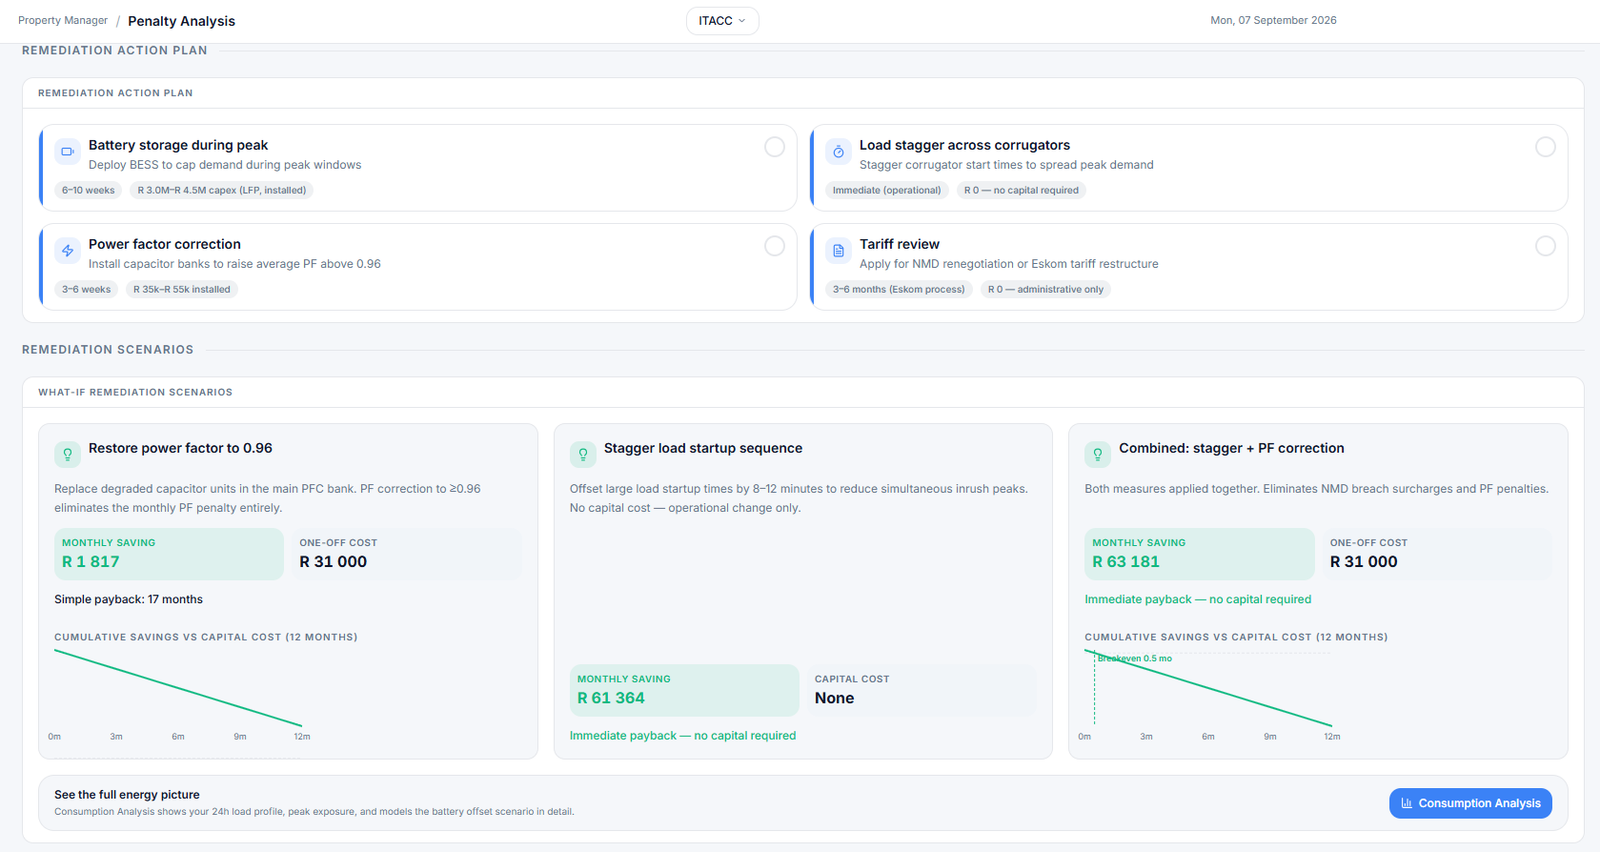
Each remediation option carries a lead time and a cost band. Below it, the scenario engine prices the options against the site's real load profile, so a client can see that a zero-capex operational change pays back immediately while a capacitor bank takes seventeen months.
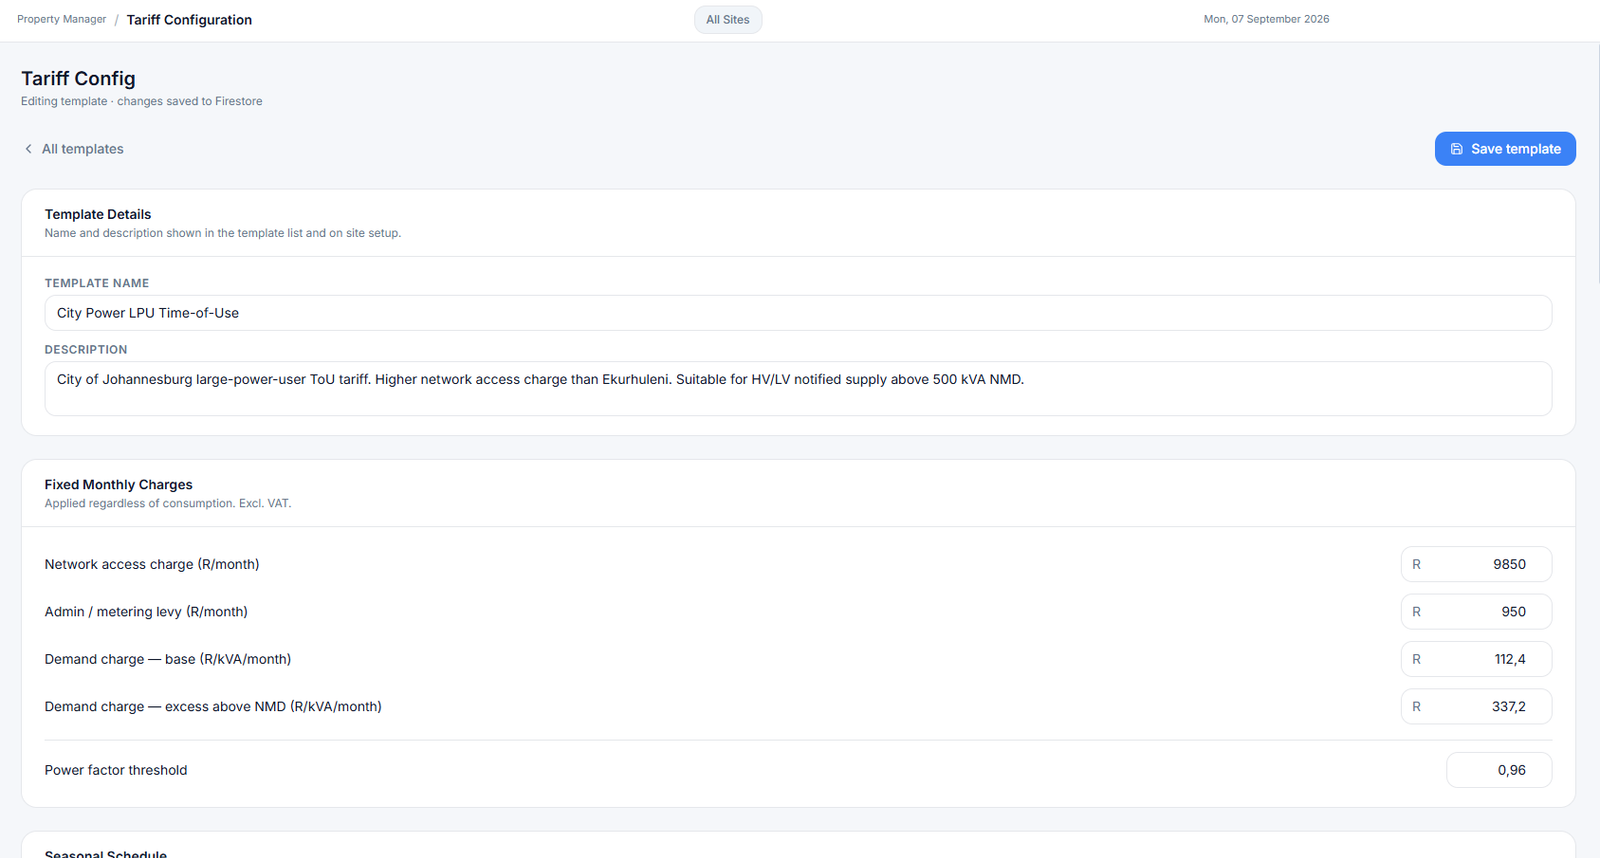
Municipal and Eskom tariffs differ by region and supply size. A template editor holds the fixed charges, demand rates, seasonal schedules and thresholds, so penalty maths stays correct when a tariff changes or a site moves.
Alerts, scheduled reports, tenant sub-metering and water consumption all live in the same platform, on the same site and meter model.
Property managers now see penalty exposure while there is still time to do something about it, and every remediation conversation starts from a number.