Vivid Power puts plant telemetry and Time-of-Use tariffs on the same screen, so a mine can see which machinery drives the peak-demand charge, what to shift out of expensive bands, and how much sun it can bank. Built by Prism as a concept to pitch to mining partners.
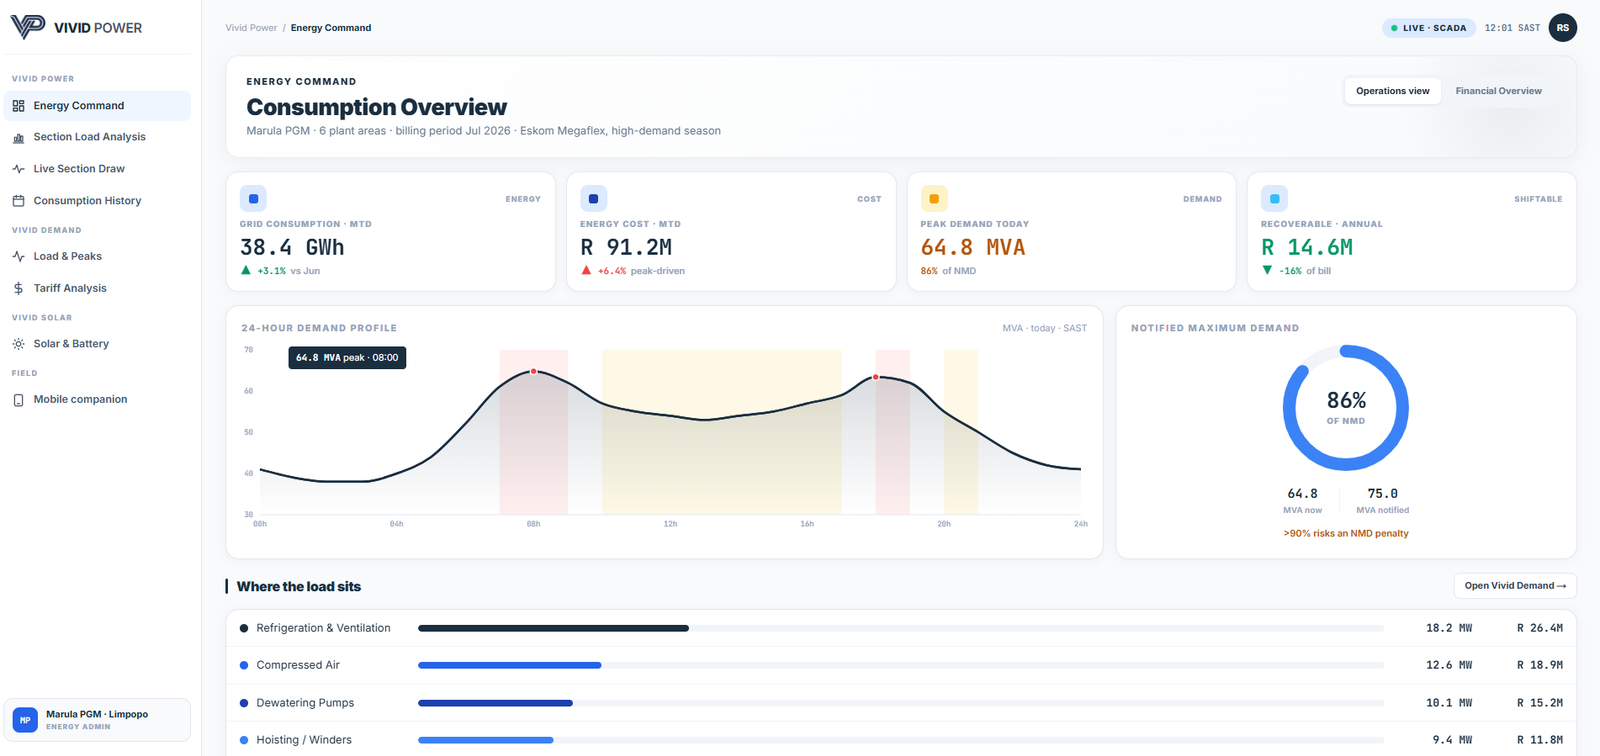
A mine's electricity bill is one of its largest and least understood costs. The plant historian knows what every compressor, pump and winder drew, minute by minute. The finance team knows the Megaflex tariff, the Time-of-Use bands and the notified maximum demand. The two never meet, so the peak-demand charge arrives as a number nobody can attribute to a machine.
Without that link, load-shifting is guesswork and a solar business case is a consultant's spreadsheet the mine cannot test against its own load.
Consumption by plant area pulled from the historian and priced against the live tariff. A 24-hour demand profile with peak bands shaded, a notified-maximum-demand gauge, and a ranked list of where the load sits and what it costs.
Which sections drive the coincident peak, how much of each is sheddable, and a predictive load-shift plan with the annual rand value of every move: pump dewatering overnight, delay mill start-up past the morning band.
A proposed PV array modelled against the mine's real daytime load, battery dispatch into the evening peak, simple payback, and a phased transition roadmap from behind-the-meter rooftop PV to wheeled PPA optimisation.
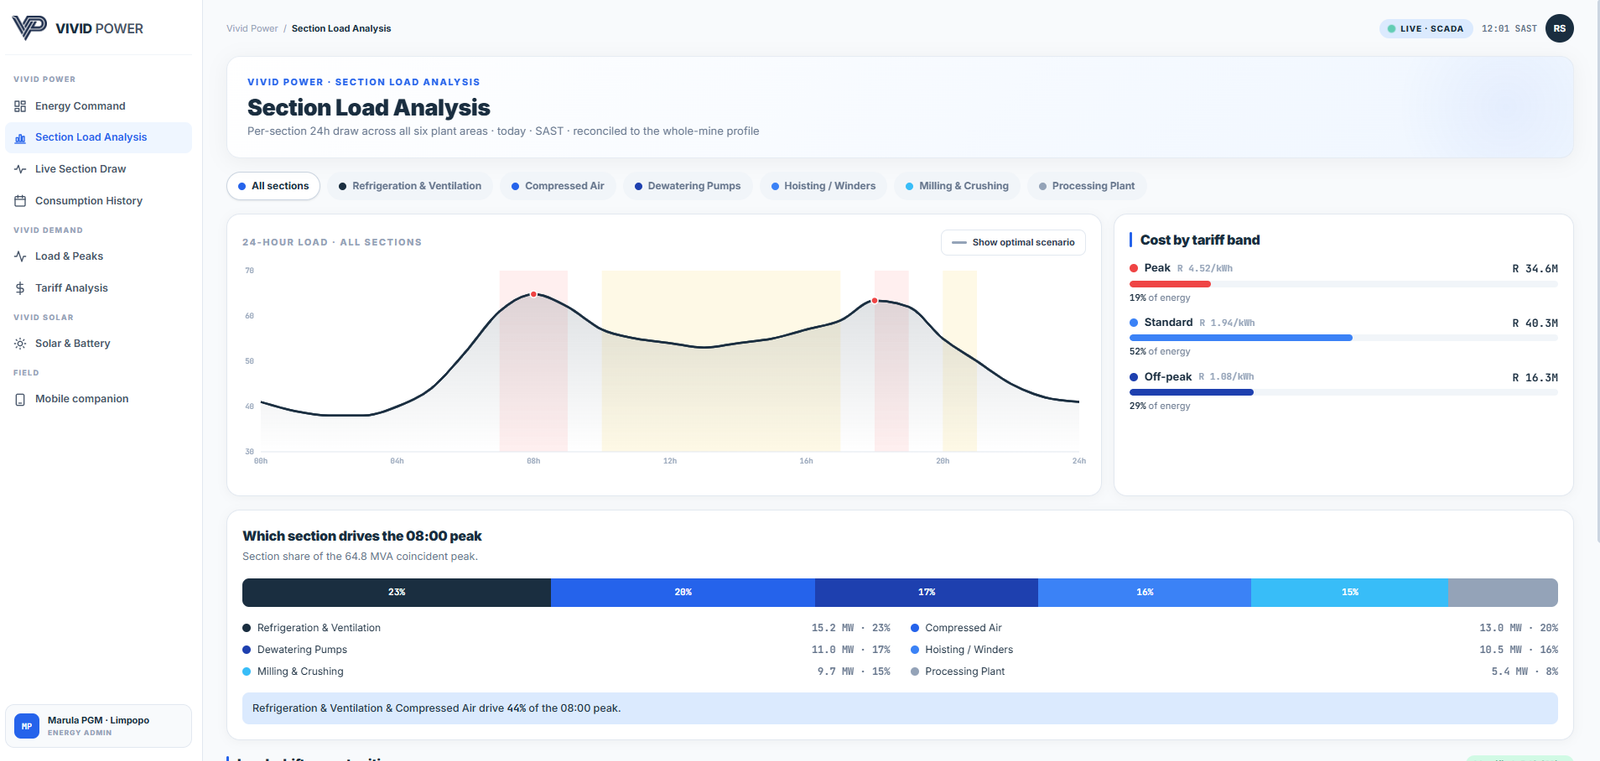
The whole-mine profile reconciled to six plant areas. Cost is split by tariff band, and the coincident peak is attributed section by section, so the answer to “who caused the 08:00 spike” is two names and a percentage, not a meeting.
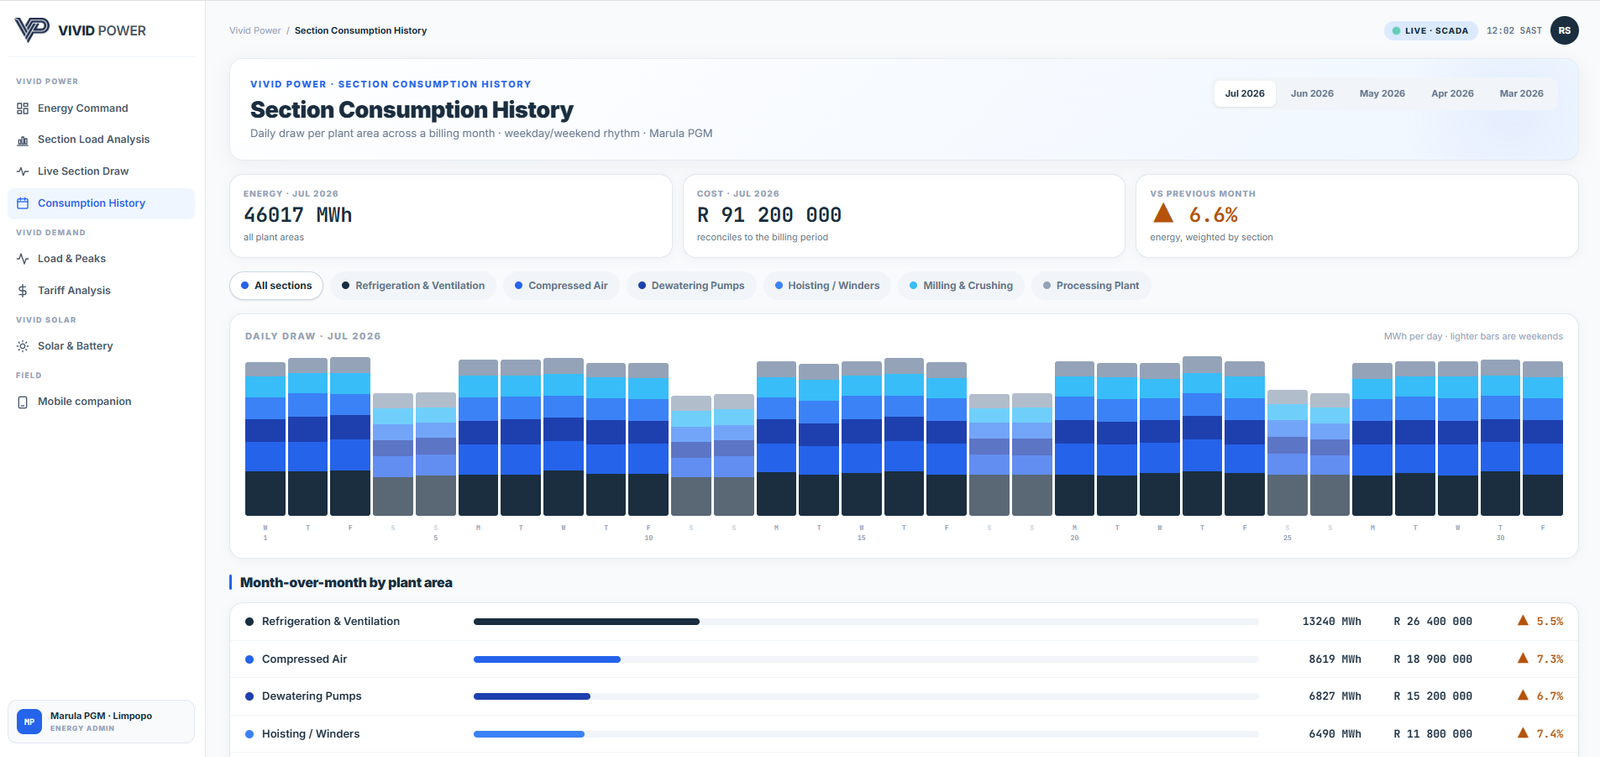
Daily draw stacked by plant area across the billing month, weekends lighter, with month-over-month movement per section. The number at the top reconciles to the invoice, which is what makes Finance trust the rest.
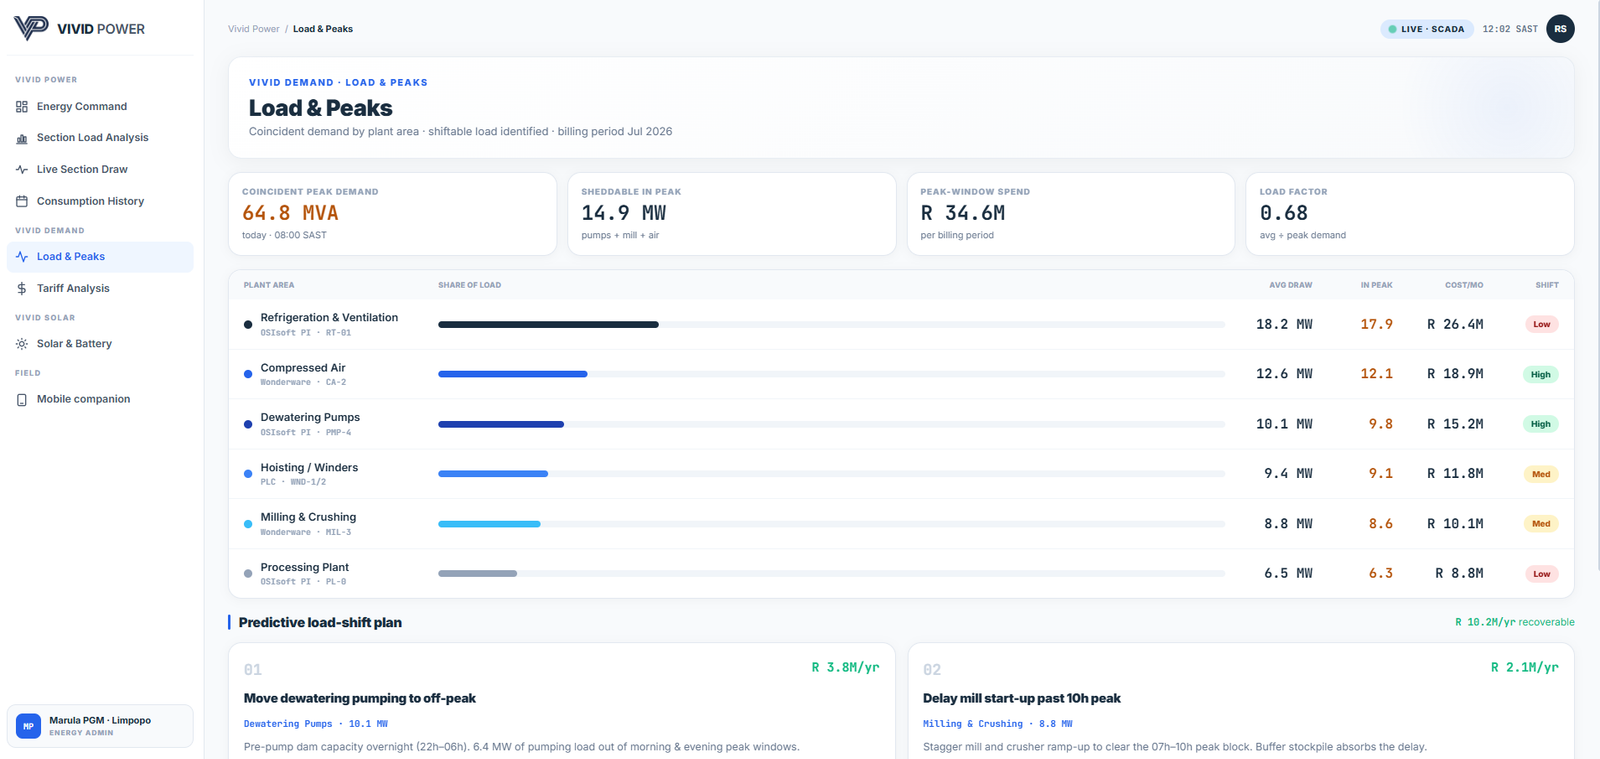
Each plant area carries its historian source, average draw, draw inside the peak window and a shift rating. Below it, the plan: concrete operational moves with the annual saving attached, ranked so the cheapest win is first.
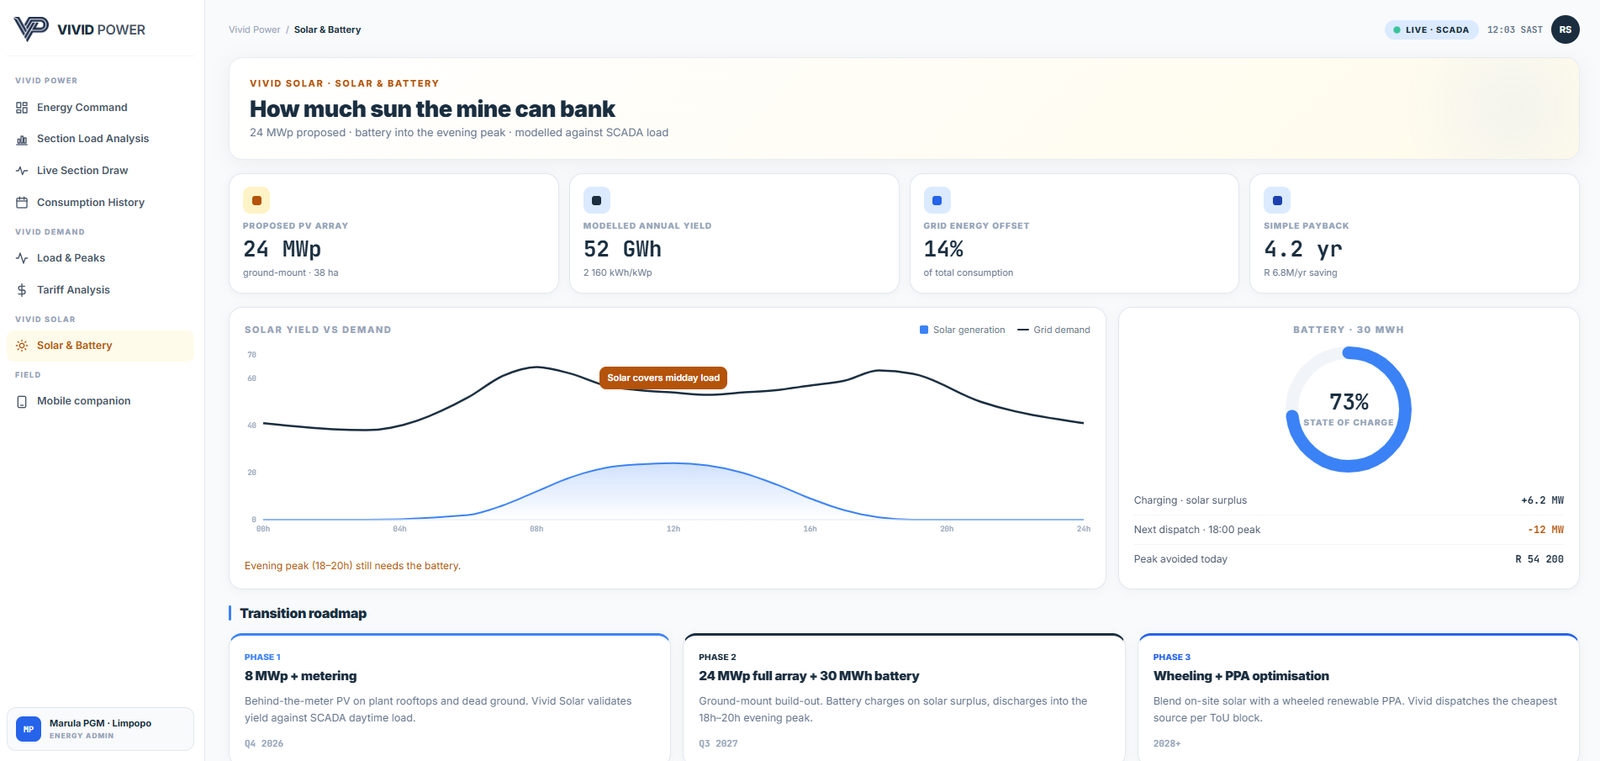
How much sun the mine can bank. PV yield is drawn against the real demand curve so it is obvious that midday is covered and the evening peak still needs the battery. The roadmap phases the build so the mine can start small and validate against its own SCADA load before the full array.
The prototype reads plant-area consumption from the data historians mines already have, and carries the tariff logic itself, so there is nothing new to install on the plant side.
Demo-ready on modelled data. The next step is a pilot on one mine's live historian, and we are looking for the partner to run it with.
Talk to us about a pilot