
The dashboard is the easy part.
Ask an AI tool for a fuel dashboard and you’ll have one in minutes. Clean charts, the right colours, a big number at the top. It will show you that number with complete confidence, whether or not it’s right.
Four minutes to a dashboard
This part is real, and it’s useful. Point an AI tool at a spreadsheet or a database and ask for a dashboard, and you’ll get something that looks finished: a KPI strip, a trend chart, a table you can sort.
Charts used to take days. Now they take minutes. That changes what it costs to build one, but it doesn’t change what makes one worth looking at.
Three sources, three numbers
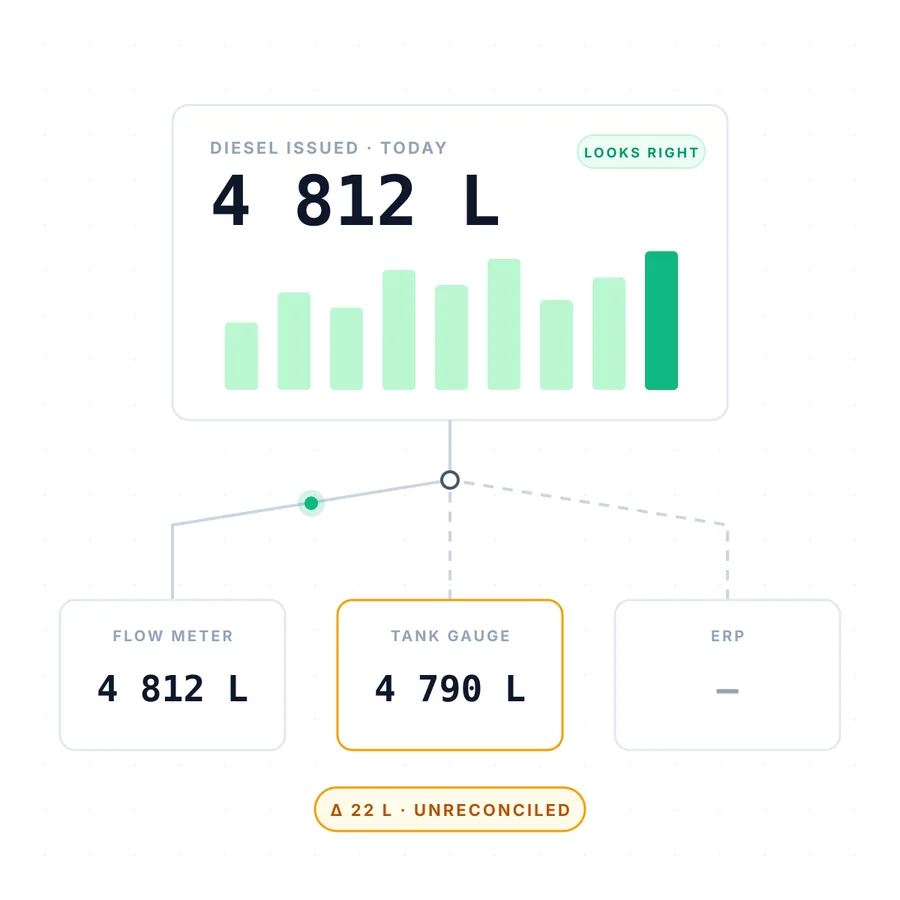
Take diesel. On a typical site, the same day’s issues are recorded in at least three places: the flow meter on the pump, the gauge in the tank, and the ERP where someone captured the transaction.
They rarely agree. The meter says 4 812 litres. The tank says 4 790. The ERP hasn’t been updated yet. All three are “the data”.
An AI tool asked to show diesel issued will pick one and draw it beautifully. It has no way of knowing that the 22-litre gap might be normal temperature variance, or a meter that needs calibrating, or diesel walking off site. Or that the figure you can claim for the SARS Schedule 6 rebate depends on which record holds up under audit.
That isn’t a charting problem. It’s knowing the operation.
Definitions drift
The same thing happens away from mines. A finance writer documented AI building two dashboards that showed two different revenue figures, because each one used a slightly different definition of revenue. Neither was wrong on its own terms. Together they were useless. As he put it: “Ten definitions of revenue is the same as none.”
Every business has numbers like this: litres, revenue, availability, a “completed” job. Someone has to decide what each one means, write it down, and make every report use it.
Pretty and wrong is worse than ugly and right
A rough spreadsheet invites questions. A polished dashboard discourages them. The better it looks, the more people trust it, and the longer a wrong number survives.
A chart is a picture of a decision. Someone has to make the decision first.
How we build instead
- We start with the data model and the definitions: what each number means and where it comes from.
- Where sources disagree, we build the reconciliation in, so differences are shown and explained instead of hidden.
- The screens come last. That’s where AI saves us the most time.
- You get a written scope, with the cost, before any build starts.
The dashboard is the easy part. We make sure the number on it is right.
- Jim Smart, AI Builds the Dashboard. That Was Never the Hard Part, Nexairi, 9 July 2026. https://nexairi.com/article/Finance/agentic-bi-semantic-model-finance-dashboard-trust-2026/
- Darragh Murray, Dead on Arrival: The AI Dashboard Problem, The Datavist, 26 May 2026. https://thedatavist.substack.com/p/dead-on-arrival-the-ai-dashboard
(The diesel example is illustrative, from our experience in fuel management, and is not any client’s data.)
You run the business. We’ll answer for the system.